
Overround and Margin Analysis in Virtual Horse Racing
 Available in US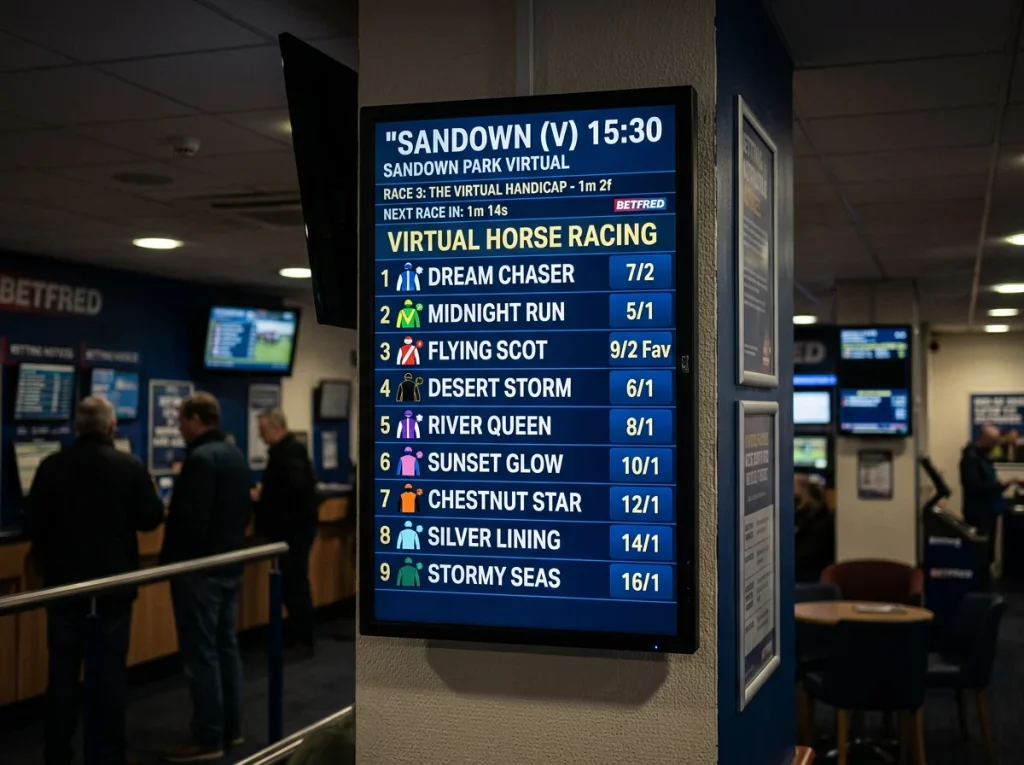
Locating Bookmaker Margins in Pre-Determined Virtual Books
Years ago I sat down at a betting shop counter with a notebook and a pen and added up the implied probabilities on a virtual eight-runner card. The numbers came to 110.4%. I did this for ten consecutive races on the same product. The result was 110.4% on every single one, to one decimal place. That was the moment I stopped thinking about virtual overround the way I thought about real-race overround.
On a real race, the overround — that bit of book margin above 100% — is the result of many separate price quotes from many traders and many money flows being aggregated into a final tableau. It moves through the day. It tightens as more money arrives. It widens when there is uncertainty. On a virtual race, the overround is pre-stamped. The provider’s probability model generates the runner chances, then the operator applies a fixed margin slice across those chances to produce the prices you see. The result on screen is identical in form to a real book — prices that sum above 100% — but the mechanism is entirely different. There is no aggregation. There is no movement. The margin is a parameter, not a market outcome.
This is why Inspired’s published RTP band of 80% to 92.1% across bet types translates directly into book margins of 7.9% to 20% on virtual cards. On the Coral product, where the Playtech engine sits at a flat 90% RTP, the book margin is essentially 10% across every race, every cycle, every day. The number does not drift. It is engineered in.
That predictability is, paradoxically, what makes virtual overround worth understanding more closely than real-race overround. On real racing the margin varies, so analysing it is partly an estimation exercise. On virtual the margin is a fixed product feature. Once you can read it, you know exactly what slice the operator is taking before you place a single bet.
Implied Probability on a Virtual Card
The arithmetic of implied probability is the same on virtual as on real, which is useful because the conversion is something most punters can do in their head with practice. A price quoted as fractional odds — say 4/1 — converts to implied probability by adding the two sides and dividing the second side into the total. 4/1 means 1 divided by 5, which is 0.2, or 20%. A horse at 4/1 is being priced as if it has a 20% chance of winning. The same arithmetic applies for any fractional price.
Decimal odds make the conversion even simpler. Decimal 5.0 is the same as 4/1, and 1 divided by 5.0 is 0.2. The decimal format strips out the mental gymnastics of fractional conversion, which is why most analytical work in this space is done in decimal even when the customer interface displays fractional.
The interesting part starts when you add up every implied probability on a virtual card. On a fair book — one with no margin — the implieds would sum to exactly 100%. One of the horses has to win, after all. The probabilities of every possible winner must add to certainty. Any sum above 100% is the operator’s overround. A book that sums to 110% has a 10% overround. The customer is, in effect, paying for 110% worth of probability to get 100% worth of outcome.
The mechanical translation between RTP and overround is the part that catches people out. On a Win bet with no place complications, RTP and overround are reciprocal — if the operator is taking 10% margin, RTP is 90%, and the book sums to roughly 111% if you do the strict division. The shorthand of “10% overround means 90% RTP” is close enough for everyday purposes. Where the maths gets messy is on each-way and exotic markets, where multiple stake portions and different fractional reductions distort the simple one-to-one mapping. But for straight Win betting on a virtual card, the rule of thumb holds.
What this means in practice is that you can audit any virtual card in about a minute. Open the runners, add the implieds, compare the sum to 100%. The excess is what the operator is keeping in long-run terms. If you ever see a virtual card summing to over 115%, the operator is running aggressively margined relative to industry norms.
How an Overround Is Built Into a Virtual Round
The construction of a virtual book is, when you see it laid out, more deliberate than most punters assume. The provider’s RNG generates a probability distribution for the eight runners — these are the “true” probabilities, the numbers the simulation actually uses to decide who wins. On a fair, unmargined model these would sum to 100%. The operator never displays these numbers. They are the back-end of the product.
What gets displayed on the front-end is the same distribution with a margin slice applied. The mechanics of the margin application can be even — meaning the operator reduces each horse’s implied chance by the same percentage point — or weighted, meaning longshots get a heavier reduction than favourites. Most UK virtual products use a weighted approach, which is why the Inspired RTP range varies between 80% and 92.1%. The 92.1% appears on favourite-heavy bets where the margin sits closer to a single uniform slice. The 80% appears on longshots and exotic markets where the margin is layered on more steeply.
To make this concrete, imagine an eight-runner virtual card where the true probabilities, summing to 100%, are: 25%, 18%, 15%, 12%, 10%, 8%, 7%, 5%. The operator applies a 10% overround using a weighted method. The displayed implieds become roughly: 27%, 19.5%, 16%, 13%, 11%, 9%, 8%, 6%. They sum to about 109.5%. Each horse is now being offered at slightly worse than its true chance. The customer-facing odds, derived from these implieds, are accordingly shorter than they would be on a fair book.
The horse that was a true 25% favourite — fair price 3/1 — is now displayed at around 11/4 once you back out the implied 27%. The longshot that was a true 5% chance — fair price 19/1 — is now displayed at around 15/1 because its implied has been pushed up further by the weighted margin. The favourite has lost about 8% of its fair price. The longshot has lost about 21%. This is the structural reason longshot value is worse on virtual than on real. The margin is not flat.
The operator can adjust this calibration at the configuration level. The published RTP band defines the limits the testing labs have certified, so the operator cannot push outside that range without re-certification. Within the band, they have flexibility. The 2026 Remote Gaming Duty rise from 21% to 40% in the UK has, by the account of Inspired CEO Brooks Pierce, prompted operators to adjust RTP and bonusing structures — meaning the calibration of overround on virtual products has, in real terms, moved during 2026. The mechanics of that adjustment, and how it sits alongside the operator’s broader cost structure, is something I cover in more detail in my analysis of RTP and house edge in virtual horse racing.
Worked 8-Runner Example: Where the 10% Goes
Take a clean example. An eight-runner virtual race at a UK operator running a 90% RTP product. The displayed prices on the card are:
Runner 1 at 5/2 — implied 28.6%. Runner 2 at 7/2 — implied 22.2%. Runner 3 at 9/2 — implied 18.2%. Runner 4 at 7/1 — implied 12.5%. Runner 5 at 9/1 — implied 10%. Runner 6 at 12/1 — implied 7.7%. Runner 7 at 14/1 — implied 6.7%. Runner 8 at 20/1 — implied 4.8%.
Add the implieds: 28.6 plus 22.2 plus 18.2 plus 12.5 plus 10 plus 7.7 plus 6.7 plus 4.8. The sum is 110.7%. The overround is 10.7%. The operator is taking just under 11% of the book in margin.
Where does that 10.7% go in practice? Imagine one thousand pounds bet across the field at stakes proportional to the implied probabilities. The favourite at 5/2 attracts 286 pounds. The 7/2 attracts 222 pounds. And so on, down to 48 pounds on the 20/1 shot. The total staked is 1,000 pounds. The winning horse, whichever it is, returns the same gross — because the book is balanced. The favourite winning pays out 286 multiplied by 3.5, which is roughly 1,001 pounds. The 20/1 winning pays out 48 multiplied by 21, which is roughly 1,008 pounds. Across all outcomes the operator pays out around 903 pounds gross on 1,000 pounds staked. The retained margin — the difference between 1,000 staked and 903 paid out — is the 10.7% overround in cash terms.
The point of this worked example is that the 10.7% is not extracted from any single losing bet. It is distributed across the entire book as the gap between probability cost and probability payout. On a virtual card running thousands of cycles a day, this gap accumulates into the operator’s gross revenue from the product. It is the product margin, fully visible to anyone willing to add up the column.
How Virtual Overround Compares With Real-Race Books
Real-race UK overround on a typical eight-runner handicap from a major bookmaker sits around 115% to 120% in retail and tightens to perhaps 105% to 110% on the exchanges close to off-time. The exchange figure is genuinely competitive — it reflects pure market-making with thin trader margin. The retail figure carries the operator’s full cost structure, including counter staff, shop overheads and marketing.
Virtual overround sits in roughly the same band as the tighter end of retail, around 108% to 112% depending on operator. This is not a coincidence. Virtual is positioned as an alternative product within the same retail channel, and pricing it dramatically wider than real would push customers back to real markets. Pricing it dramatically tighter would expose the operator to RTP costs the product cannot sustain at the volumes virtual generates.
What distinguishes virtual from real, despite the broadly comparable overround, is the absence of market movement and the absence of value pockets. On real racing a careful punter can occasionally find a runner whose true chance is materially better than the displayed price — a horse the market has priced wrong because the information has not flowed through. On virtual that opportunity does not exist. The price reflects the simulation’s parameters exactly, with the margin applied uniformly across cycles. The book is fair, in the sense that it is mathematically auditable, but it is also closed. There is no edge to find. The 10% overround is the entire game.
Frequently Asked Questions
Is overround the same as house edge in virtual racing?
They are two ways of describing the same number. Overround is the percentage by which the book sums above 100% — the operator"s margin expressed as a market percentage. House edge is the long-run percentage the operator keeps from staked money. On a straight Win bet, a 10% overround corresponds to a roughly 10% house edge and a 90% RTP. The numbers diverge slightly on exotics and each-way because of how stakes are split.
Can a UK operator adjust the overround of a virtual book?
Yes, within the limits certified by the testing lab. The published RTP band — for Inspired Racing the range is 80% to 92.1% across bet types — defines the floor and ceiling for any overround adjustment. The operator can tune within that range to reflect business conditions, including the 2026 Remote Gaming Duty rise from 21% to 40%. Pushing outside the band would require re-certification.
Why is virtual overround higher than the typical real-race exchange book?
Exchange books are pure peer-to-peer markets with thin trader commission. Virtual books carry the supplier licensing cost, the operator"s retail or platform overhead, and a margin reserve for the fixed-odds nature of the product — the operator cannot lay off risk to other traders mid-race, so a thicker cushion is built in. Virtual overround typically lands closer to a tight retail real-race book than to an exchange.
Articles
Prepared by the Horse Racing Bet Game editorial staff.
